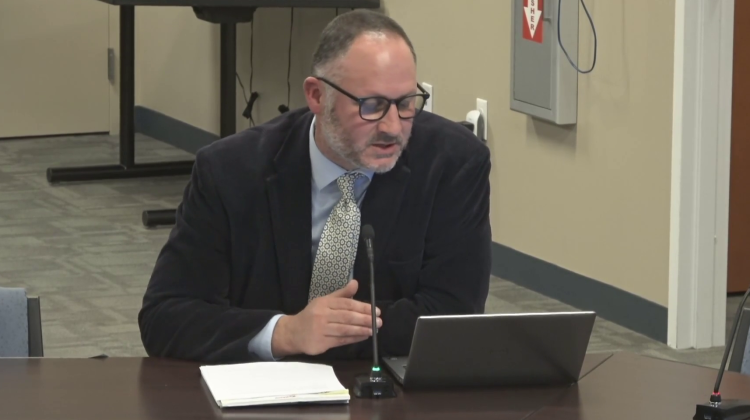
LYNNFIELD – Lynnfield Public Schools Assistant Superintendent Adam Federico presented data on LPS’ performance during the School Committee meeting on Nov. 4. Alongside representatives from each of the grade level groups (elementary, middle, and high school), he showed that Lynnfield’s students are meeting or exceeding state expectations at a rate better than statewide average in every category.
“Lots of data goes into how we do business in Lynnfield,” said Federico.
On the broader end of things, data analysis is used to prioritize spending, putting more dollars where the data shows weaker performance. It is also used in narrower ways, such as the data collected with the Star Renaissance assessment system that students engage with throughout the year.
Aggregates of the Star Renaissance data were not presented during this meeting, but Federico assured the Committee that it will be included in the future by pairing that data with the MCAS results LPS will receive from the state, as well as Advanced Placement test results.
That data is currently being used to tailor approaches to what the Massachusetts Department of Elementary and Secondary Education (DESE) calls “differentiated instruction” in the classroom. Differentiated instruction refers to what teachers do to meet all their students’ needs rather than teaching their entire class in the same way.
Federico said students have made “moderate growth in all areas,” and added that, in already high performing districts, growth is expected to be moderate. He went on to say, “I want to remind people we’re scoring consistently; I think our kids are achieving and growing consistently, and there’s stability there.”
DESE provides a blueprint for gauging and responding to student performance, known as the Multi-Tiered System of Support (MTSS). This blueprint outlines three tiers of student support, with two higher tiers for struggling students or those who have some kind of special needs, such as a disability, being a member of a low income household, or are in the process of learning English as a second language.
Of all students in the LPS school system, 28.4% are in this “High Needs” category.
“Almost one-third of our school system is designated as high needs. I think that’s a number that bears recognizing and understanding, that one-third of students bring some sort of a challenge — or something extra — to the table that we need to support them with,” Federico said.
The state calculates percentile scores that can be used to compare between similar schools and between school districts in aggregate. A percentile score of 50% for a school means that school performed better on average than half of schools it was compared with. In Lynnfield, the lowest percentile scoring school was Huckleberry Hill, which performed better than 78% of elementary schools in the state. The highest was Summer Street, performing better than 95% of comparable schools.
The same percentile scoring process can also be used to compare between sub-populations of students, such as those in the “High Needs” category.
In Lynnfield’s data, students are sub-categorized based on the kind of support they need, which Federico referred to as “sub-groups.” All sub-groups of students showed some form of performance growth, showing that despite their challenges, the students in these groups are improving.


